The neuromarketing study
The study itself was conducted in Stockholm, Sweden. In total, 568 in-person interviews (45% women, age mean = 38 years, std = 12 years) were conducted over three rounds with several months apart. 32 national and international brands were part of the study. The brands represented industries such as automobile, telco, casino, and more. We also used the Rossiter-Percy grid to analyze how ads from different industries performed in terms of involvement and transformation (not included in this case report).
Participants were asked to go through different news media on a phone, desktop, and printed newspapers. In all cases, we controlled which ads were shown on each platform -- even in print, we had the opportunity to use unique newspapers where ads were put as part of the study. As part of the study, we ensured ad exposure for all ads and all relevant pages/sites. The instructions were that we were interested in understanding how they read the contents of the different media channels, and that they were told to behave as they would normally do when going on different news media outlets.

During the task, participants were wearing a pair of eye-tracking glasses and an EEG brain monitor. This allowed us to measure visual attention, as well as emotional and cognitive responses during the entire test. Two weeks after the ad exposure, participants were asked to fill out a survey containing questions about their tasks and the stories they had read. In addition, they were asked whether they remembered any of the ads and which brand they were from.,
The 4-power model
The theoretical model used was based on prior studies in marketing and consumer psychology. This led us to focus on four main steps that are crucial to understanding advertising success to ensure brand building.

As the figure also mentions, each of the steps are coupled with neuroscience (NeuroMetric) measures and metrics. The actual measures include:
- Stopping power: eye-tracking measures of percent seen and the time spent with the ad or area of interest
- Transmission power: EEG-based measures of working memory demands, also known as cognitive load
- Persuasion power: EEG-based measures of emotional responses, divided into arousal (intensity) and motivation (valence, direction)
- Locking power: survey-based memory responses at a 2-week follow-up of whether participants remembered the ad, or both the ad and the brand. As we will show, we also successfully used NeuroMetric scores to predict locking power (something we call "projected locking power")
,
Key findings
Over the course of the three test rounds, we saw an emerging picture for each of the powers. These can first be shown for each powers.
Stopping power
When comparing whether people noticed ads across the platforms, we saw that newspaper ads performed best (83.4% of ads seen), followed by mobile (65.5%) and then desktop (51.4%). In the below figure, this is shown on the y-axis. We also quantified how much time people spent with the ad while it was available, which is marked along the x-axis.
Here, ads on print received less time than mobile and desktop. However, as the chart shows, individual ads also perform very differently, suggesting that there is definitely room for design-related optimization of ad responses.
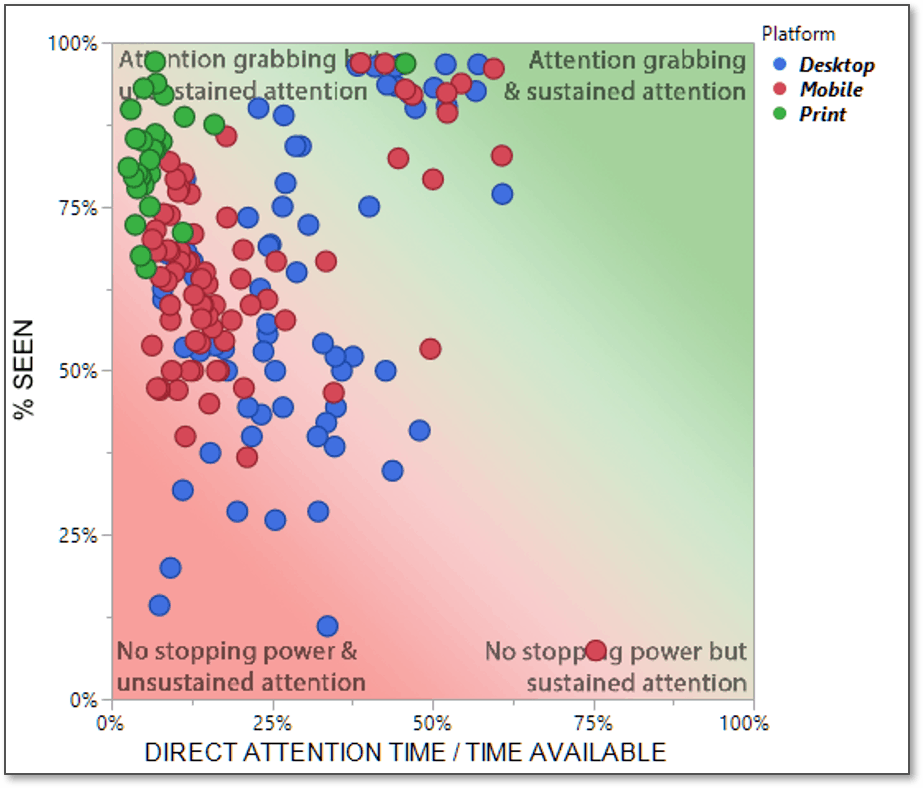
Digging further into these findings, we found that the platforms varied a lot in terms of their ability for ads to grab and sustain attention.
Transmission power
In general, we saw that ads produced comparable emotional responses, but larger variance for cognitive load. Here, we found that mobile ads produced a higher cognitive load compared to print and desktop. The cognitive load level for mobile was so high that it could be considered to be close to "overload" in which case viewers tend to lose interest and start looking at other places.
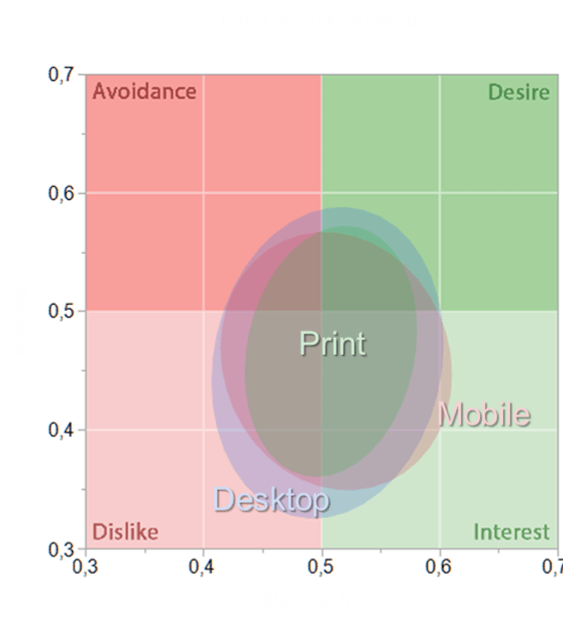
This is shown in the Feeling-Thinking plot below, where we show motivation (x-axis) and cognitive load (y-axis) to highlight the relationship between emotional and cognitive responses. For transmission power, cognitive load is most important.
Persuasion power
For emotional responses we saw few general differences between platforms. Once seen, ads produced more or less the same emotional responses, both in terms of arousal and motivation. That said, we saw that print generated more coherent responses while desktop produced larger variation in emotional responses.
This suggests that there may be platform differences in the emotional dynamics to ads. This could mean that desktop ads (and mobile, to some extent) produce stronger fluctuations in ad responses, which in itself is often a good thing: you definitely would like your ads to produce emotional responses. This is also shown in the emotion plot below -- this graph shows the relationship between motivation (x-axis) and arousal (y-axis), and we use a coloring system to highlight where optimal responses are.
Locking power
For ads' ability to be remembered, we saw no large variance across media platforms. Indeed, despite receiving a lot of initial visual attention, we see that print was not as successful in ensuring ad memory compared to mobile and desktop.

Additional findings
One of the questions we wanted to answer is whether particular ad elements could affect an ad's ability to be noticed, to generate positive emotions, to be understood and to be remembered. Below is a list of dos and don'ts for each of the powers:
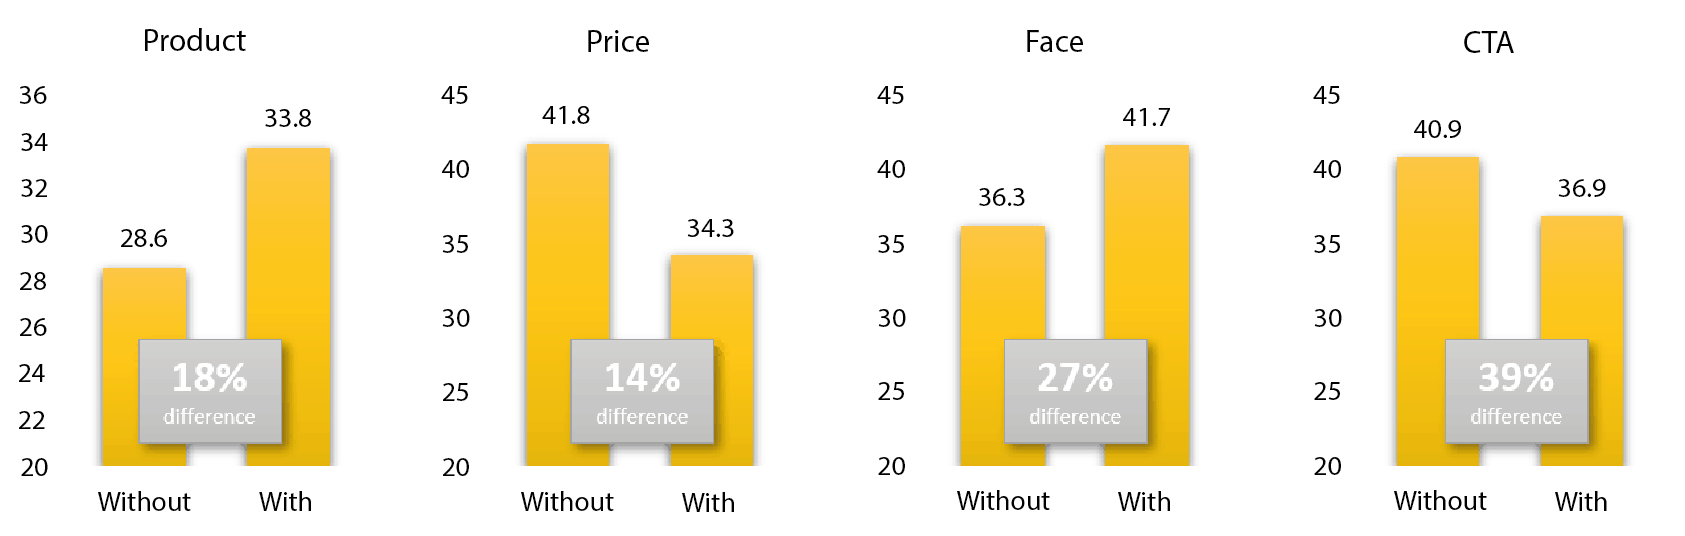
For stopping power, we saw that having a product and faces boosts attention, while price and call to action (CTA) elements reduced attention:
For transmission power, we found that products increased cognitive processing slightly, while text reduced processing a bit:
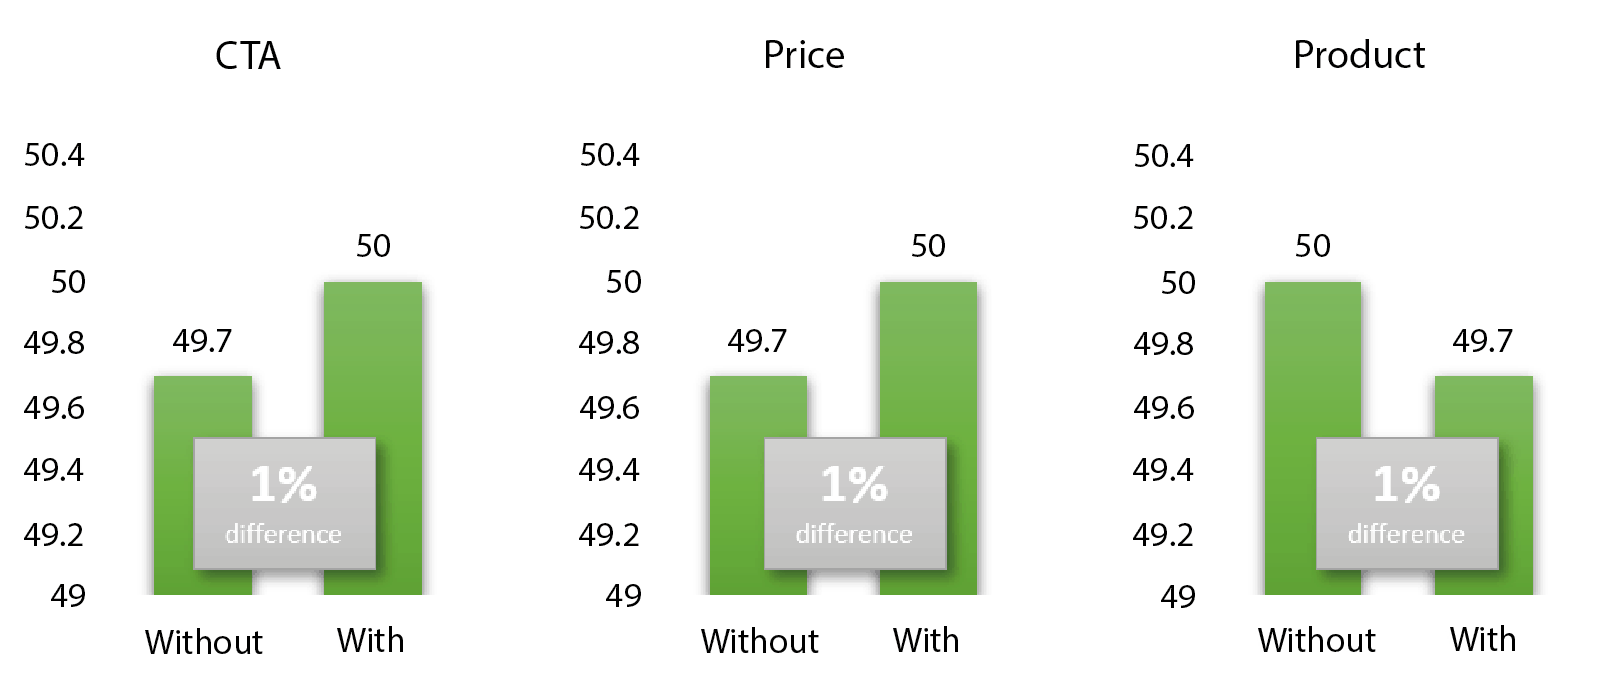
Going to persuasion power, the changes we saw were small yet significant. To boost emotions, CTA and price were the most powerful, while emotional drops were found when ads showed products:
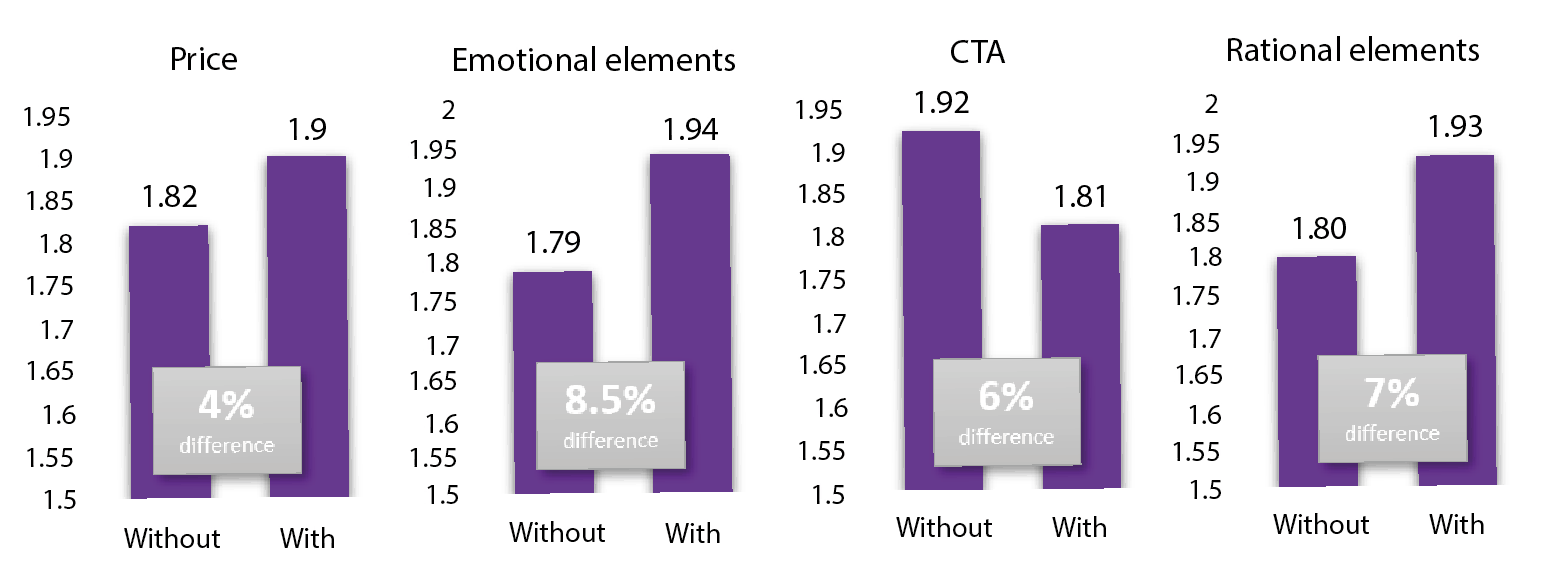
Finally, to ensure ad memory (locking power) we saw that price, and ads with both emotional and rational elements were more likely to be remembered, while ads with a CTA were less likely to be remembered:
Taken together, these findings suggest that there are ways in which one can tailor ads to contain or leave out elements to serve their goals. It also suggests that elements do not work in the same direction. If you want to have an ad that boosts attention, show products and faces but leave out CTA.
If you want to make sure that people remember your ad, remember to include both emotional and rational elements in the ad. Some effects might even work against each other. Price boosts emotions but reduces ad memory. Sometimes, however, this is OK: CTA ads need people to act here and now. Emotional responses are more important than the ad being remembered weeks later.,
The billion-neuro database
Through the study with Stanford and Bonnier, Neurons accumulated no less than 2.5 billion data points of brain responses. Besides this, we recorded close to 300 hours of eye-tracking data to ads across platforms. Together, this database is among the largest known for a single study.
While this case report only contains a few highlights, the Bonnier team and each of the 32 brands received in-depth analyses of both general findings, industry-specific findings, and responses for each of the ads they had used. The power of neuro is not only in the new, unparalleled access to customers' responses; it also lies in the sheer amount of data that allow us to look at data from a range of angles.
Contact us!
If you're interested in learning more about us and our capabilities, learn more by booking a demo. We look forward to hearing from you!


.svg)

.svg)