
A recent open access article is out from Ale Smidts’ lab, the person who is often cited as the one to coin “neuromarketing” as a discipline for applied research. Smidts, being among the most impactful scholars in this discipline has now worked with Esther Eijlers and Maarten Boksem to provide compelling new support for a claim that commercial neuromarketers have long made: that it is possible to measure emotions as they unfold over time.
The problem and the need
Take the classical problem: how can you track how people respond to events as they happen over time? You certainly can't ask them every other second "how do you feel now? And how about now?" Besides that being a most strange practice for both the participant and the experimenter, it would also lead to a highly artificial and disruptive environment for otherwise normal consumer behaviors. Indeed, asking people to observe their every response would actually lead to a change in what they would feel. Introspection changes the object of perception!
Instead, what is needed is a way to track emotions as they unfold over time. For example, one could hope that the appealing fMRI method would be good for this purpose. However, despite its alluring brain "heat maps" fMRI is actually not very good for measuring emotions over time. It is superior for understanding where in the brain such effects happen, but for understanding how they unfold over time, other methods are much better. And with a temporal resolution of 2 seconds or so, it is only so much that you can measure "unfolding" in the brain over time.
A measure for emotional unfolding
Enter EEG -- electroencephalography -- which is the measurement of electrical discharges as they happen on a millisecond scale. Neuromarketers have long touted that this is possible, and some early studies also supported this. However, the article by Eijlers, Smidts and Boksem provides a clear demonstration of just how precise this can be.
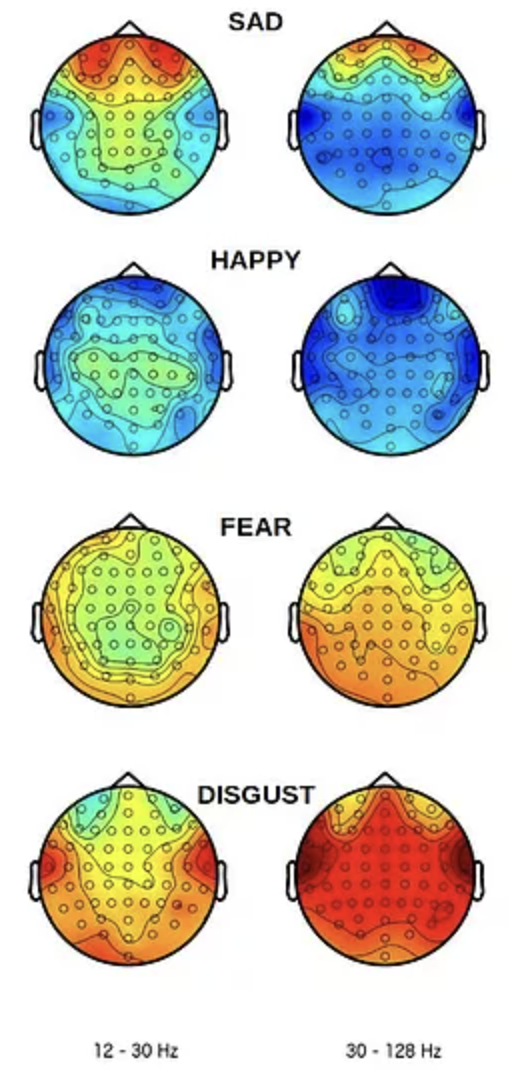
As the figure above shows, there were highly specific patterns of activity, even in selected bands such as the beta (12-30 Hz) and gamma bands (30-128 Hz). Here, warmer colors denote increase engagement, while cooler/blue colors represent less engagement in the frequency band. The head is shown from above and with the nose on top.
So what did they do? In the study, the researchers provided video elements that showed how people's responses happened over time to different predefined movies. By using a classifier analysis, they were successfully able to distinguish between four main emotions: happy, sad, fear and disgust.
Emotions unfolding
The team then tested these metrics as they unfolded over time to the cartoon movie UP. Here, they demonstrated that the positive (below: purple) and negative (blue) emotional responses mirrored the expected effect from what happened over the course of the movie.

The study by Eijlers, Smidts and Boksem represents a changing trend in academic and applied research: that there is increasing convergence on methods, and a validation of the methods and metrics in use for tracking, understanding and affecting consumer experiences. Even more, as consumer neuroscience is rising even more as a viable addition to traditional research methods such as surveys, focus groups, and interviews, we are now experiencing something rather rare: the independent confirmation of methods that are being offered commercially. Since this has been one of the main concerns for newcomers to this area, and those that have rightfully felt that "neuromarketing" was littered with dubious cowboy claims, we now see only one way forward, which is through validated research methods and neurometrics.


.png)


